Category Archives: Tools

Podcasts and the Digital Humanities

More than any other medium, podcasting allows creators and listeners to establish a sense of shared experience. One could argue that a writer seeks to achieve such a connection with readers, however, it is undeniable that podcasting has a greater degree of success on this count. One reason for this may simply be the feeling of direct connection created by the human voice, this evokes a “presence” that we do not quite get when we read a text. In any case, this feeling of shared experience, of being “in the presence” or even “witnessing” something through our senses before it appeals to our imagination, creates a sense of immediacy and proximity to the stories or information communicated through the podcast. 

Humanities podcasts are also able to incorporate resources that are used in the written form, but not as effectively. Most scholarly writing uses both narrative and analytical styles. In both instances, authors make reference to the work of other scholars to strengthen their arguments and provide examples. The podcast allows for such references to be added in structured interviews or in a more conversational style. In Throughline’s episode “The Lavender Scare”, for instance, the hosts follow a narrative structure that incorporates the voices of scholars as well as actors readings quotes from historical sources. All of these are used to advance the narrative, as opposed to being presented in response to direct questions. Consolation Prize combines both styles. It follows primarily a narrative structure and the voices of actors and scholars are also used to advance the narrative. However, there are also instances in which scholars are either responding to questions or, reflecting on sources and interpretations. The World of Benjamin Franklin falls squarely in the conversational/ interview style of podcast. Here Liz Covart, the host, starts a conversation with a scholar. Sometimes responses offer a narrative or a description, but they are also pieces of analysis, interpretation and reflection. In all three cases, the podcast format enables listeners to feel like they are on the same journey of exploration as the host and guests, and it is this sense of shared experience that, I believe, is most successfully achieved in the podcast medium.

Podcasting may be seen as the great disseminator of humanities scholarship. By creating a sense of connection between the general public and the producers of humanities scholarship, podcast are able to communicate scholarly knowledge with much greater ease and confidence than other media. At a time when attention spans are waning and people seem less inclined and interested in going through the trouble of following complex stories and analysis, podcast help create a environment of ease and trust where listeners may be able to relax and leave their guard down as they learn something new.

What has made podcasts into this powerful medium are precisely the digital tools and formats that are now available to scholars and the public at large. In the past, audio production required sophisticated recording and production equipment, not to mention access to the airwaves. Today, there are many services that enable quality recording, software that facilitates production, and the internet through which audio files can be transmitted with great ease. Although producing a podcast does require time, technical expertise, equipment and funding, these are much more affordable and accessible than ever. The entry costs for scholars have been seriously reduced and the ability to reach listeners has multiplied. In this regard, podcasts may represent one of the most aspirational aspects of digital humanities, in that it brings scholarship closer to the public. Unlike crowdsourcing, podcasting does not necessarily bring the public into the production of knowledge. However, the best type of podcasting will enable members of the public a better understanding of what scholarship is and how it works.

Digital Humanities and Crowdsourcing

Back in the mid-1990s, as an undergraduate student,  I participated in a project where we were recruited to make an inventory of Mexican history secondary sources available in the public and private libraries located in Mexico City. We were all given a long a long list of books and we were charged with visiting one library, determine whether there were copies of the listed books  in the library assigned to us, and add other sources that were not included in the original list. At the time, only a few academic libraries had digitized their catalogues and, in most cases, the process was still ongoing. What was still not available was the possibility to search these catalogues remotely. Thus, the goal of our project was to produce a bibliography that could allow students and researchers to locate particular sources without having to spend time visiting different libraries throughout the city. A project like this became unnecessary when digital catalogues were made available online. In this case, technology was able to solve one problem, but crowdsourcing remains a useful approach for processes and activities for which modern technology has not been able to provide solutions.

In my last post I talked about how AI chatbots, such as ChatGPT, were the latest technological response to the question of how to process vast amounts of information. Despite the progress that AI technology has achieved, it seems clear that there are still good reasons to continue using human beings in the process of producing knowledge. The idea of using large numbers of people to collect or process large bodies of documents, sources or data is not new. As my experience shows, this approach has been useful when the volume of the materials that needed to be processed was too large, and the nature of the work did not require too much training or expertise. The advent of digital technologies has made it possible to reach more people as potential contributors. Also, the increasing digitization of documents and other types of sources has created a (hopefully) virtuous circle in which crowdsourcing can be used as a means to increase access to historical and cultural materials and, by creating greater access, it can also encourage more engagement from the public.

As we have seen in this module, crowdsourcing is useful to open the process of knowledge production to a wider public. This can be done by asking people to write and edit entries in a project such as Wikipedia, or to contribute individual experiences during a particular event, as was possible in the September 11 Digital Archive. In both cases, members of the public are instructed to work under a set of rules, but are otherwise encouraged to be part of a collective exercise of data collection and interpretation. In these cases, technology has made it possible to reach a larger number of people while also lowering the barriers for their participation.

Other uses for crowdsourcing involve the processing of large volumes of material that cannot be achieved  using computers. Projects of transcription such as Transcribing Bentham, or description of photographs such as Nasa on the Commons, emanate from the need to make materials more accessible through digitization. But this goal also requires the infrastructure by which documents and images can be more accurately catalogued, searched, and studied. Current technology enables us to publish digital photographs and documents on library and museum websites; but it is not yet capable to read all types of handwriting or describe the contents of a photograph. For these, we still need people. So it is not surprise that some large digitization projects are often accompanied by a crowdsourcing component. An example of this is Linked Jazz where members of the public are asked to characterize the relationships that were described in the interviews with Jazz artists. 

Thus, projects that lend themselves to a crowdsourcing approach will typically involve the creation or processing of large volume of materials, where contributors need little or no expertise, and that are aimed at expanding access to the process of knowledge production. Transcription, basic annotation and description, collection, are processes that, under the right planning and circumstances, can be achieved through crowdsourcing.

Careful planning does make a difference to the success of crowdsourcing projects. First, it is important to cast a wide enough net to reach as many people as possible. Second, it is vital to create the infrastructure and incentives that can keep contributors engaged. This is best achieved when a project can explain how the use, preparation and processing of sources lies at the foundation of knowledge production; thus turning what are often seen as meaningless tasks into essential steps in the preservation, dissemination and interpretation of sources. By allowing people access to sources that would normally be reserved to specialists, crowdsourcing projects start by establishing a relationship of trust that is further enhanced when contributors are entrusted to re-tell, read, transcribe, describe or interpret. This trust, however, can be intimidating if contributors do not feel supported and confident that they will have the time to learn while on the job. Thus, it is vital that crowdsourcing projects develop mechanisms for support and communication with contributors and interfaces that are easy to use. But the most important incentive, in my view, is the feeling that by committing to a task, contributors can develop expertise and the value of their work will continue to increase. I believe this cultivates greater engagement and ownership of the overall project. 

Ultimately, the success of crowdsourcing projects can be measured by their ability to engage the public in the process of knowledge production. If contributors feel they can enhance their skills and  are empowered to make meaningful contributions, they will remain committed to the value and success of the larger project

Crowdsourcing

More than 20 years after its creation, Wikipedia illustrates the benefits and pitfalls of crowdsourced information. What started as a site widely distrusted by most, it managed to create a model for open collaboration that has gradually earned a healthy measure of trust among the public and even the scholarly community. One reason why many of us have come to appreciate Wikipedia, despite its many flaws, is that  it has worked hard to bolster what my teachers used to call its “critical apparatus”. That is, it has created the means for other scholars to critique the content and structure of the material presented in its many pages.

As a young student of history, I was taught that the citations in my papers constituted the “critical apparatus.” Among scholars, it is through citations and references that one is able to support one’s claims. The critical apparatus created through these tools constitute the main source of authority for any given piece of scholarship. However, the public’s reliance on reference works, such as encyclopedias, is contingent on their reputation, which in itself is built upon its editorial processes and the people they employ. Wikipedia’s model of open collaboration encourages the use of citations and references, but also allows the public not only to participate in the editorial process, but to see what changes are being proposed for individual articles and to discuss said changes with other individuals also involved in editing a page. This opening-up of the editorial process adds, in my opinion, to the critical apparatus of Wikipedia articles. 

The examination of the “Digital Humanities” article in Wikipedia serves as a good illustration of how tools such as the “Revision History” or the “Talk History” expand our ability to evaluate the quality of a page. A cursory read of the Wikipedia article on “Digital Humanities” shows a reasonably well-organized article with numerous references, a bibliography and recommendations for further reading. Given what we have learned about the field of Digital Humanities, it is reasonable to ask how complete and how up-to-date the article is, how recently, and how often has the page been edited and to what degree. When we looked for a term or topic in a traditional encyclopedia we would accept that, many topics, would be out-of-date given the time lag between when an article was written and published and when it was read. The level of authority on any given piece decreases as time passes. However, as my father used to say about  national Constitutions, the authority of any set of statements requires a balance between stability and flexibility. I would argue that the authority of an encyclopedia article is also contingent on how stable and flexible they are. The fact that an article can be updated as new information becomes available, but not change radically from one version to the next, is a factor that adds to its authority.

The “Digital Humanities” article was last edited on October 2023 but, for the past two years the edits have been relatively minor. One can appreciate this by looking at the revision history tool, where it is possible to see when the page was first created and one one can examine every single version of the article. The revision history will show the date when an edit was done, how many bytes were added, how many words were added or deleted, and there will be a brief description of the changes. One also has the possibility of comparing two versions. Although this particular feature was difficult to use because the changes appear out of the context of the larger page. I found it easier to specifically open different versions and then choose what versions I wanted to explore further. 

Other important information that can be ascertained from the revision history is included in the the Statistics information. Here, one can find how many times a particular page has been edited and at what rate. In the case of the “Digital Humanities” article we can see that since 2006, when the page was originally created, it has been edited 1009 times, 459 editors have made contributions. In average, each user has done 2.2 edits and the page has been edited, in average, every 6.4 days. However, most of the most substantive edits took place in the earlier years of the page. During the past 365 days, only 7 edits have taken place and these have been relatively minor. 

As a reader one can take some confidence of the fact that the page seems that have reached some stability and that further changes to it seem to be of a minor nature. As a student in the Digital Humanities one could wonder whether this means that debates about the definition, history, and scope of the field have been resolved. For this, the Talk History tool may prove very useful. Here, one can see what have been the issues that have preoccupied the editors, how the explain an edit, when they seek comments or advise on a particular change. In the case of the “Digital Humanities” article we can see that the “Concerns” section of the talk history, includes a lot of comments about the history and the definition of Digital humanities. There are also questions about balancing the different types of tools that are included in the Methods, and Projects of Digital Humanities.

Traditional encyclopedias presented themselves as sources of authority due to their editorial processes. Some were open about who were the authors of their articles, others kept those anonymous. In an attempt to foster participation, while also maintaining transparency and accountability, Wikipedia offers contributors both options . One can add an edit to a page without disclosing a name or without creating a user profile. In this case, the edit is recorded under an ISP. But many contributors do create a user name and a profile, and this can be used as another means to read and evaluate a particular entry. By looking at the Statistics page one can determine which contributors have made the most contributions and when. From there one can also see their profiles, if they have created one. From the ten most prolific contributors to the “Digital Humanities” article (at least in terms of words); two are just identified by their ISP, and two have profile names but no information under their profile. Two more are students participating in a Wikipedia-related curriculum. Only about five of them have been active within the last five years. Which again speaks to how relatively stable the page has become. Only one of the contributors, its creator in fact, identifies himself as a scholar and professional in the digital humanities. A couple of contributors identify themselves as scholars in computing or the humanities. 

Learning about the identities, and maybe even qualifications, of contributors may be more relevant to students and/or scholars that to the casual visitor. The latter can rely on the general Assessment of a page which can also be found in the Statistics page and explained in the Assessments page. But for scholars, students or other experts, learning about the contributors to a page is very useful to contextualize and understand the criteria they use when explaining and justifying their editorial decisions. The revision history and the talk history enable us to do a historiographical analysis of any given article, the more we know about the authors of these versions the more informed our analysis and evaluation will be. 

As an organization, Wikipedia has made substantial investments in building a critical apparatus that supports its reputation as an authoritative source of knowledge; not because Wikipedia articles are perfect, but because anyone can identify its sources and follow the process by which they have been created. In contrast, ChatGPT has stayed closer to a notion of “the wisdom of crowds” in that its source of authority is contingent upon the vast volumes of information used to teach be chatbot. In the case of Wikipedia, the crowds involved in creating its articles are people, engaged in an ongoing discussion of what to add, delete or change. ChatGPT uses much of this knowledge to produce elegantly explained answers in a way that seems very simple and clear to the reader. However, we do not get any sense of the sources that were used or the criteria used to select information. In this case ChatGPT lacks a “critical apparatus” on which to rest its authority. It purely relies on a crowd of anonymous sources. ChatGPT is able to elegantly synthesize large bodies of knowledge in the most clear and simple way. However, sources like Wikipedia demonstrate that even a work of synthesis needs to make choices and it is important for readers to understand what are the justifications for these choices. The questions of accuracy that we used to have about Wikipedia are multiplied in the case of ChatGPT since we have no mechanism to assess its accuracy, completeness, or judgements. ChatGPT can produce very clear explanations and narratives, but in this case, clarity may obscure the inherent complexity and messiness of knowledge production.

Comparing Tools

The tools examined during the past three modules, Voyant, Kepler, and Palladio, allowed for different levels of data analysis and visualization. One could see these tools are serving different needs dictated by the kind of data-set that need to examined. Voyant enables researchers to text-mine large volumes of mostly unstructured text. Kepler produces map visualizations that require files that have been tagged for geographical locations. Palladio creates network visualizations that required highly structured files.

One could say that Voyant offered the opportunity of a relatively open-ended exploration of the WPA Slave Narratives.As a text mining tool, Voyant proved to be very effective when examining a large volume of relatively unstructured data. The five tools included in Voyant (Cirrus, Reader, Trends, Summary and Contexts) provide different entry points into the data and different ways in which said data could be re-organized, explored and visualized. Although Voyant is largely meant to be used by researchers, I can also see how it could be used by public historians, museum professionals and teachers. The Cirrus tool, for instance, produces powerful visualization that can enrich lectures and exhibits. In contrast, I found the Trends tool more difficult to manipulate and read. It was easy to see how many times a word would appear in the different State collections, but I could not easily explore other kinds of trends such chronological distribution, age or gender.  These limitations are understandable given that text mining seeks for individual words or groups of words, and not for categories of words.

Kepler used more structured data than the one used in Voyant. For this reason, we were able to illustrate different aspects of the WPA Slave Narratives. The maps we produced, using geo-tagged CSV files, allowed us to see the relative volume of interviews done in a particular region. It was also possible to create a map that presented a timeline. Yet, the visualizations produced with Kepler did not give us any idea about the content of the interviews. Thus, I found Kepler to be a very good complement to Voyant. While Voyant provided us with the possibility of analyzing the content of the interviews, Kepler enabled us to visualize the broader geographical and chronological context in which the interviews were performed. Also, I found the visualizations created with Kepler were easier to read and manipulate than those produced to Voyant. This is not a criticism of the effectiveness of Voyant. When working with Kepler we used a smaller and more structured data-set prepared to answer more focused questions about time, place and volume; while Voyant was meant to facilitate a more open ended exploration of the ideas contained in a much larger set of documents. 

The last tool we used was Palladio, a network analysis and visualization tool. From all the tools examined, Palladio required the most rich and structured data-set. The goal of this tool is to allow researcher to identify patterns of connection or relationships between different categories of data. Palladio was very effective when producing visualization of different types of relationships. For instance, we are able to create a map where we saw where slaves had been enslaved in relation to where they were interviewed. We were also able to illustrate connections between the topics addressed in the interviews and the gender, age, or type of work of former slaves. In this regard, Palladio proved to be the most flexible of all three tools in terms of the kinds of questions it could help researchers explore. But the power of the tool was only made possible by the quality of the data and the way in which it was structured. 

Experimenting with these tools made me more aware of the challenges and potential inherent to the use of digitized sources. Ultimately, the use of any of these tools will require that data is digitized and structured to some degree and in light of particular questions. For this reason, I think it is important to have different types of tools that work with different types of files. Tools that allow for more open-ended questions like Voyant, or for a more focused exploration like Palladio. In either case, the larger challenge is to ensure that the digitization and preparation of the data is done thoughtfully and professionally. The ultimate effectiveness of any of these tools will largely depend on the quality of the data and the expertise of the researchers using it.

Palladio and Network Graphs

Network visualization projects allow users to observe the amount and overall shape of connections between individuals, institutions, locations, etc. The information used to document these connections can be extracted from different types of digitized materials. Arguably, the power of this type of visualization lies in its ability to highlight patterns a of discreet connections that are not easy to discern in large text corpora.

Working with Palladio made it possible to see more clearly the strengths and weaknesses of network visualizations. One point that was made very clear in the readings, and in the projects we examined, is that this type of visualizations require a careful and informed preparation of the data that is to be used. For this example, we were given three csv. files from the WPA Slave Narratives project that had been prepared to be used with Palladio. Even with this clear advantage, it took me a good forty minutes to upload the files. Every time I tried to load a file I got a message alerting me to an error in one of the lines. But I could not figure out what the error was. In the end, I decided not to use a downloaded file, but I simply opened it directly from the link and copied and pasted the contents into Palladio. Somehow, this did the trick and I was able start the work.  This was just a good example of how useful it is to understand the requirements of the software and the ways in which data should be presented.

For our first exercise we were asked to do a map visualization. In this case, we were to connect the place where interviewees had been enslaved with the place where they were interviewed. The first map visualization used the background of a land map, which was useful to get an idea of how far or how close former slaves had worked before they moved to Alabama. The map showed that the majority of slaves interviewed in Alabama had been enslaved relatively closely to where they were interviewed. Very few came from further north. The second visualization removed the map base, leaving an image that resembled more a network graph, but without a what nods and edges represented. This was a good way of understanding better the differences between a map visualization and a network graph and the possibilities of each of these tools. 

A third exercise asked us to produce a network graph. In this case, the particular features of the network visualization (the ability to highlight one type of nod, to make them bigger or smaller depending on the number of interviews) made the visualization more useful to discern the how many slaves interviewed in particular Alabama locations had come from other places. By focusing on some of the larger nods, a researcher could find some meaningful patters about the movement of slaves during the years after emancipation. However, I have to admit that my knowledge of the historiography on this question only allowed for some general observations, which, in this case confirmed what we had seen in the map, that slaves came from many different places, but mostly had not moved very far from where they had been enslaved.

These exercises illustrate what can be both a weakness and a strength of network visualization. Network graphs can tell a lot of information about discreet types of data, but they can only handle so many variables at one time, a very large volume of information can produce a visualization that is difficult to read. However, Palladio allows users to filter some of the data that goes into a visualization. For instance, we were asked to create a graph that illustrated the relationship between Interviewers and Interview Subjects. We were then able to use facets to further filter the data that went into the visualization. In this case we chose to filter by Gender and Type of  Work. I was not able to discern any particular patterns from this exercise, but it showed that the strength of network analysis relies on its ability to focus one’s attention on specific types of connections. Some will prove to be very revealing, while others much less so. But the possibility of changing the elements of the graph and exploring different configurations is where the possibilities of Palladio proved most useful.

Needless to say, however, the power and flexibility of the tool is largely contingent on the data that is used. The last set of exercises confirmed both that network analysis allows for very interesting explorations of data, but also that such data needs to be already rich and adequately formatted to allow for a successful exploration. In the last set of exercises we created network graphs that connected gender, type of work, age, and interviewer to the topics that were explored in the interviews. The different visualizations generated showed that neither of these factors seemed to have a dramatic impact on the topics addressed by former slaves. However, these observations are based on the general overall visualizations. Subtle differences may yet to be discovered if we were to further filter the data. Which brings me back to the factors that can make or break this kind of tool, first the quality and richness of the data itself, and the level of expertise of those designing and using the tool.

Could this not be asked of any other research project, digital or otherwise? Is the expense and preparation invested in this kind of project proportional to the time saved or the potential findings? In my original review I concluded that it is not always clear that the research gains justify the investment involved in creating and deploying this kind of tool. However, I also observed that what is gained may be of a different nature. Network analysis tools are not tools for the public historian hoping to bring historical thinking and historical sources to a larger public. These are sophisticated tools of analysis that should be developed by experts for experts. Their design and use require serious understanding of the sources and historiography. I am sure that had I been better versed in the history of slavery and emancipation in Alabama, some of these visualizations would have been much more meaningful to me. My experience working with Palladio, however, encouraged me to be a better historian, to be more thoughtful and intentional about the questions I ask, more careful about the assumptions I make about my evidence, and ultimately, more flexible and creative about how sources can help answer old and new questions. As it was stated repeatedly in our readings, network visualizations are not here to replace the exercise of reading through sources or becoming familiar with historiography, they are here to make us better thinkers and users of sources and historiography.

Kepler and Mapping Tools

Mapping tools allow users to organize, search, and contextualize sources and information using spatial and chronological referents. These tools enable us to create visualizations that represent the different types of information contained in a dataset, the geographical points of reference for sources, and the chronological evolution of sources and their content.

The exercise using Kepler shows that even an entry-level mapping tool can prove very useful to create visualizations that communicate different aspects of the data included in a collection of sources. For instance, the first map we created was a point map. In this type of map, every item of data (in this case every interview) appears as a single dot in a map. The number of dots in the map is equal to the total number of interviews that were conducted in the state of Alabama within the period of time covered by the dataset. This kind of map also allows the user to get some basic information about each interview, such as name, age, gender, and place of birth of the interviewee. When designing the map, it is possible to customize the kind of information available to the viewer. I found this to be a very useful entry point to the data and one that can be customized to facilitate different types of searches.

We also experimented with cluster and heat maps. These maps are meant to represent, respectively, the absolute and relative density of interviews in a particular area. I found the cluster map easier to interpret. If one hovers the cursor over the clusters, one just gets the total number of interviews included in that cluster, but no information about particular interviews. I found the Heat view more difficult to interpret, but I admit that this may have been my fault since I was not entirely sure what this view was meant to represent. Furthermore, the heat map does not offer any additional information about the interviews represented in this type of map.

My favorite map was the timeline map. This is a point map with a timeline attached to the bottom. This map allows the user to locate all the interviews conducted in the state of Alabama during the period of time covered by the data set. It also allows one to see when those interviews took place within the timeline. One can still get information about individual interviews by placing the cursor on a point in the map. In addition, one can use the slider in the timeline to see points appear in the map as time goes by. This map adds a temporal dimension to the spatial one already represented by the map.

We also experimented representing differences between the interviews contained in the data set. In this case, we chose the field “Type of Slave” to be accounted for in the visualization. In this version of the map, one could see points of different colors depending on whether the interviewee was identified as a house or field slave, or both. 

Working with Kepler confirmed my opinion that mapping tools can be useful when presenting, exploring, and analyzing data. Tools like Kepler have something to offer the observer or casual visitor to a site. They enable the creation of powerful visualizations that synthesize a large volume of information in an interface that is familiar to most people. We saw a great example of this in the Histories of the National Mall project. Researchers who are just getting started working with a collection of sources, will also find map visualizations very useful. A good example of this was Photogrammar, which offered a very flexible interface that allowed the user multiple points of entry into the collection. But more experienced researchers can also find use for these kind of tools. Mapping the Gay Guides illustrates how a thoughtful preparation of the data that considers and accounts for changes in the sources themselves, allows researchers to identify and document patterns that would be more difficult to detect if one was just reading the original sources. Overall, these sources facilitate cross-referencing between different possible areas of analysis. Mapping tools are most useful when they can offer a diversity of entry points and the possibility to see how changes in space and time affect the ideas and experiences represented in the data.

Voyant and Text Mining

Working with Voyant was quite intimidating at first. In many ways, it confirmed the impressions I had formed from reading about other text mining projects, and about text mining in general.

Sources and Materials

Text mining allows scholars to works with large collections of text, what is technically called a corpus. By applying techniques of text mining to these collections, scholars can discern trends in the use of words and/or phrases. The advantage of using text mining techniques lies precisely in the amount of sources that can be “read” in a relatively short amount of time. For example, in the three projects examined during this module we saw that in the America’s Public Bible: A Commentary, (APBAC) the author looked at two major newspaper databases Chronicling America and Nineteenth Century U.S. Newspapers. Between these, the project used more than 13 million pages. Robots reading Vogue (RRV) used every issue published by Vogue, around 400,000 pages, plus 2700 covers. Signs@40 used the archive of the journal Signs from 1975 to 2014. In all three cases, no single human being would be able to read the entire corpora used in these projects in a single life-time. 

However, not all large collections of text are equally useful or available for text mining. The use of computational methods for text mining requires that text collections are digitized using high quality techniques to minimize mistakes.  Furthermore, text collections also need to be in the public domain, or potential authors should acquire necessary permissions for text mining.

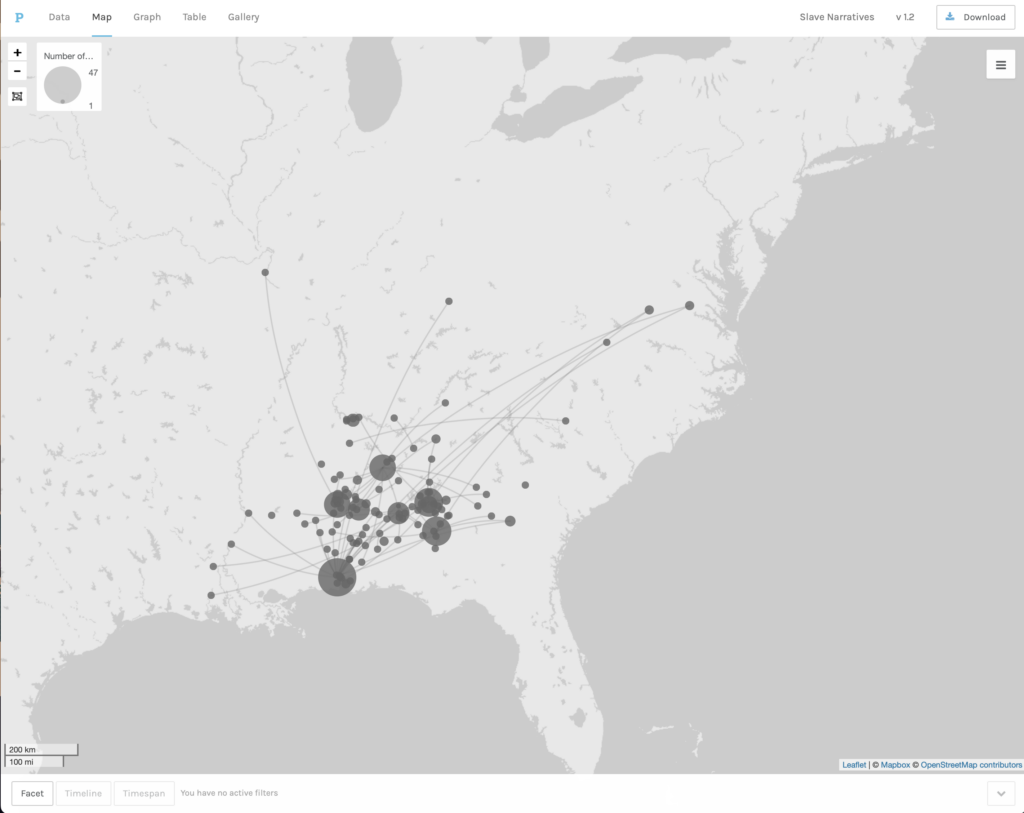
In our exercise with Voyant we worked with the WPA Slave Narratives which include more than two thousand interviews with former slaves conducted by staff of the Federal Writers’ Project of the Works Progress Administration. The materials were made available to us already cleaned and organized in 17 easy-to-use files. Having read how difficult and time consuming it can be to simply prepare a corpus for text mining, I was grateful to have this part of the process done for me. However, it is important to not forget that anyone hoping to embark on a text mining project will have to invest time and expertise on making sure the sources are adequately digitized and formatted.

What can we learn?

If one is lucky and/or persistent enough to secure the rights to a significant corpus, text mining can tell us several things about the text collection, the people who created it and organized it, and the world in which it originated. One common use of text mining is seeking trends in the usage of particular words or phrases. This is done in all three of the projects examined, although each uses this ability in different ways. For instance in APBAC, text mining is used to detect specific biblical passages. This allows the author to find out how often was a particular passage used and in what context. In RRV  one can find two examples, Word Vectors and n-gram Search where text mining is used to discern the evolution of word usage overtime. Another use of text mining is topic modeling, this traces words used in a particular context to detect important topics within a set of texts. This is used prominently in Signs@40. In general, the text mining tools used in these projects tell us about the evolution of language, ideas and practices over a period of time as reflected in the pages of publications or documents.

Working with Voyant was a little confusing at first. It took me some time to understand how to manipulate the different visualizations and understand what they were telling me. However, once I started to get a better sense of what the tools allowed me to read, I started to see their potential. The Cirrus tool may seem like an oversimplification of a long and complex text. In some ways it is, but it is this ability to present a relatively simple image of what the text is about that makes it useful. One must remember that the goal of these visualizations is not to give us a deep analysis of what this vast amount of text says or means, its objective is to help us identify a few entry points, a few questions that one could explore when one is facing a large amount of documents. Many of the terms that appeared more frequently in the whole of the corpus were clearly a function of patterns of speech and regular conversation. Words like “old”, “house”, and “slaves” were among the most frequently used terms. However, when I started focusing either on individual terms, or on specific states and terms, I started to find some interesting things. For instance, the term “mother” appeared quite prominently in the general word cloud, but if one focused on the links to this word one saw that it was most frequently connected to words like “father”, “sold”, “died”, “married”, and “children”. These, quite literally, painted a picture. I could imagine tracing the phrases that include the word mother to investigate or illustrate how motherhood was experienced or remembered by former slaves.

What questions could we ask?

Text mining analysis allows us to answer primarily general questions about the contents of a large collection of documents. Since it focuses primarily on text, it can answer questions about how language is used, how people articulated their ideas and practices, and how all of these evolved overtime. However, one has to cultivate a healthy skepticism when working with text mining techniques. First, anyone’s ability to identify meaningful entry points into a large corpus is limited or enhanced by their understanding of the historical and historiographical context in which those sources were created. In this regard, for instance, it was useful to know that there is a body of research that has investigated the experiences of female slaves and that, this historiography has given particular attention to motherhood. I am not a expert on this field, but I knew enough to know that following that term could lead to some interesting questions. A second factor that can affect the questions we could ask from text mining has to do with the chronological or geographical coverage of the collection in question. Some of the collections used in the projects examined in this model covered a no less than forty years. This meant that those working on those collections could ask questions about change or continuity over time. The Slaves Narratives collection was different in that, chronologically, it covered a relatively short period. Even though the memories that interviewers tried to elicit went back many years, the actual interviews were collected during a span of only two years. However, the interviews covered a large portion of the country. Seventeen states were represented in the dataset we used. In light of this, the nature of the questions one can reasonably ask from these interviews is quite different. Rather than focusing on how themes may have changed over time, one would ask how do interviews in one state are different from another?

For instance, using Voyant, I found it very useful to identify differences between the collections that could tell us more about the how the interviews were collected and how to read them. One exercise that was particularly useful was looking at the distinctive terms identified in two sets of documents. One of the states I examined was Florida, here I examined ten distinctive terms. It was interesting that three of these were names of places located in Florida and two were Family names. I thought this would be quite typical of all collections, but when I examined the interviews from Georgia, I was surprised that most of the distinctive terms in those interviews were related to dialect, only one was the name of a place, and there were no family or private names. One would need to investigate these collections further to account for these differences.

Historians typically divide sources between primary and secondary, and this distinction determines the kinds of questions they can ask. It is not news to any experienced historian that sources such as the Slave Narratives are difficult to place in either one of these buckets. Working with Voyant, however, highlights the importance of understanding when and how the Slave Narratives can be used as primary sources and when and how they can serve as secondary sources. Since text mining allows us to capture the totality of a corpus and then break it down in smaller pieces, one should be careful that in trying to put it back together one does draw connections that may not be warranted by the historical or historiographical context.

In the hands of a patient and knowledgeable historian, Voyant and text mining in general, can be powerful tools. Despite the care and time one needs to invest in acquiring rights, cleaning data, testing algorithms, etc. Text mining makes it possible to examine what otherwise would be an impossibly large amount of text, and thus offers a different perspective on one of the oldest and most valuable expressive and communication tools we have: words.