Palladio and Network Graphs

Network visualization projects allow users to observe the amount and overall shape of connections between individuals, institutions, locations, etc. The information used to document these connections can be extracted from different types of digitized materials. Arguably, the power of this type of visualization lies in its ability to highlight patterns a of discreet connections that are not easy to discern in large text corpora.

Working with Palladio made it possible to see more clearly the strengths and weaknesses of network visualizations. One point that was made very clear in the readings, and in the projects we examined, is that this type of visualizations require a careful and informed preparation of the data that is to be used. For this example, we were given three csv. files from the WPA Slave Narratives project that had been prepared to be used with Palladio. Even with this clear advantage, it took me a good forty minutes to upload the files. Every time I tried to load a file I got a message alerting me to an error in one of the lines. But I could not figure out what the error was. In the end, I decided not to use a downloaded file, but I simply opened it directly from the link and copied and pasted the contents into Palladio. Somehow, this did the trick and I was able start the work.  This was just a good example of how useful it is to understand the requirements of the software and the ways in which data should be presented.

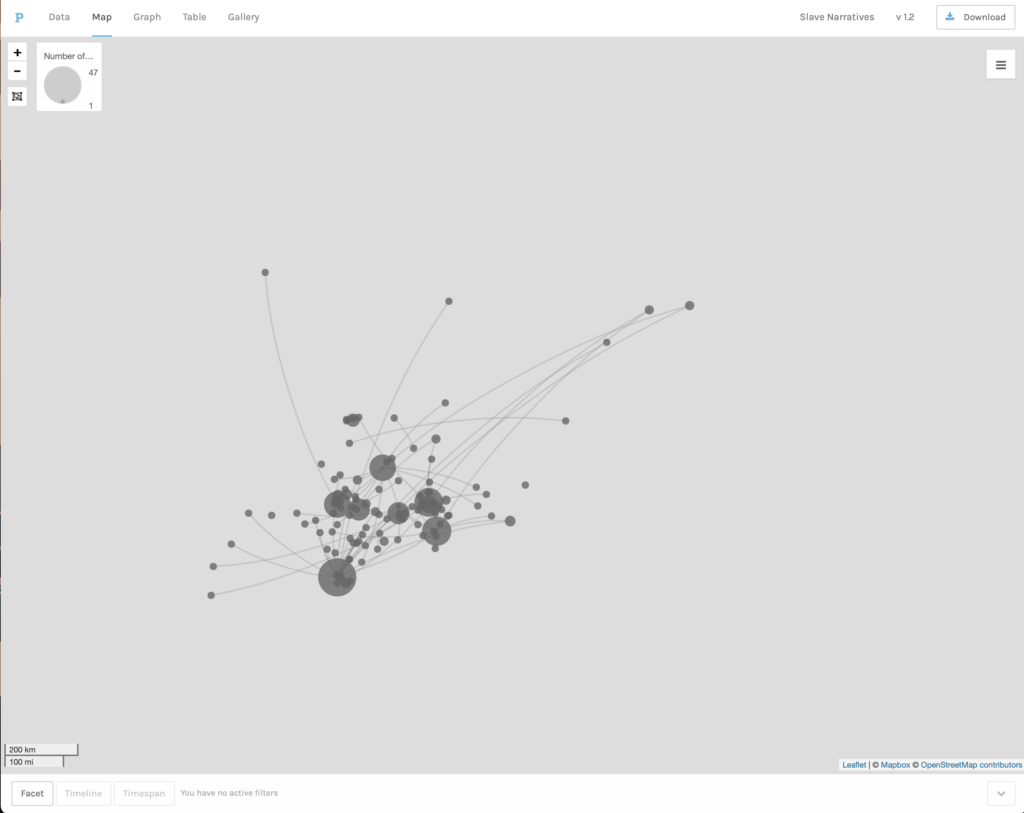
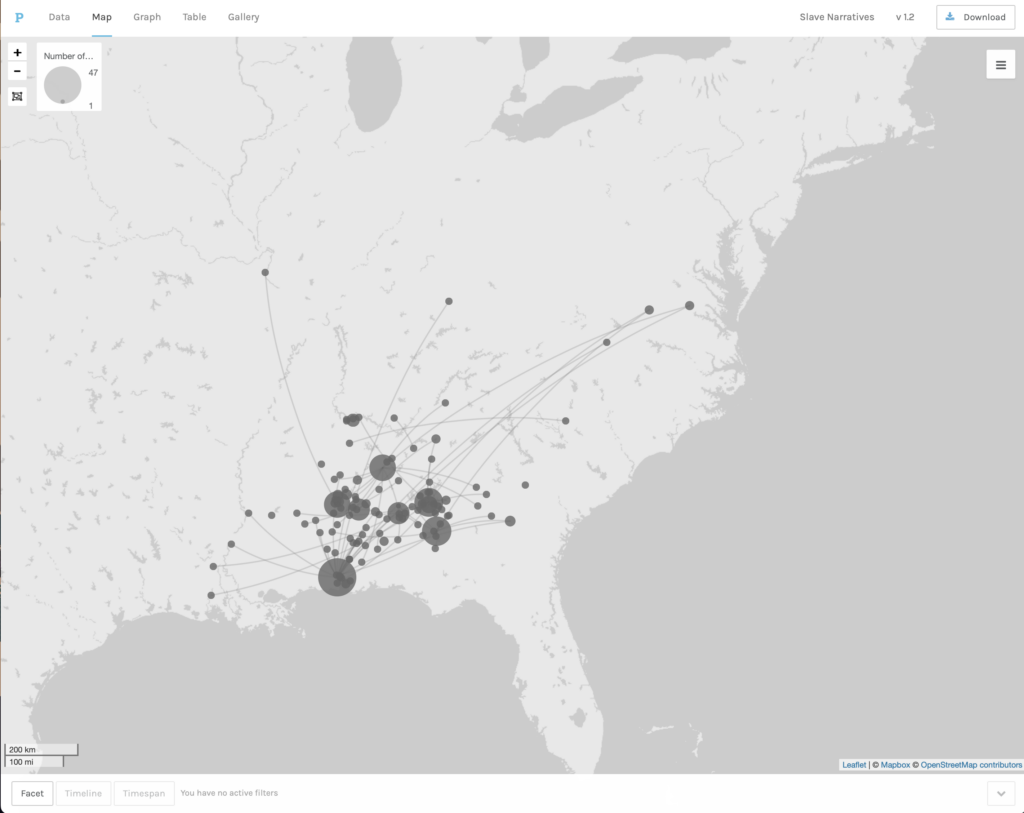
For our first exercise we were asked to do a map visualization. In this case, we were to connect the place where interviewees had been enslaved with the place where they were interviewed. The first map visualization used the background of a land map, which was useful to get an idea of how far or how close former slaves had worked before they moved to Alabama. The map showed that the majority of slaves interviewed in Alabama had been enslaved relatively closely to where they were interviewed. Very few came from further north. The second visualization removed the map base, leaving an image that resembled more a network graph, but without a what nods and edges represented. This was a good way of understanding better the differences between a map visualization and a network graph and the possibilities of each of these tools. 
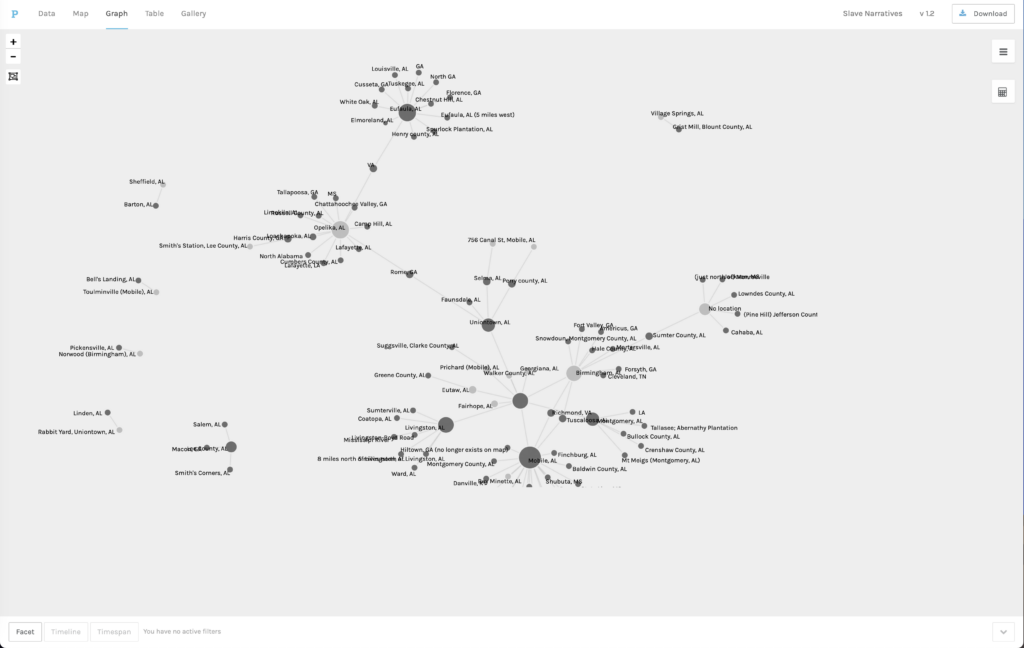
A third exercise asked us to produce a network graph. In this case, the particular features of the network visualization (the ability to highlight one type of nod, to make them bigger or smaller depending on the number of interviews) made the visualization more useful to discern the how many slaves interviewed in particular Alabama locations had come from other places. By focusing on some of the larger nods, a researcher could find some meaningful patters about the movement of slaves during the years after emancipation. However, I have to admit that my knowledge of the historiography on this question only allowed for some general observations, which, in this case confirmed what we had seen in the map, that slaves came from many different places, but mostly had not moved very far from where they had been enslaved.
These exercises illustrate what can be both a weakness and a strength of network visualization. Network graphs can tell a lot of information about discreet types of data, but they can only handle so many variables at one time, a very large volume of information can produce a visualization that is difficult to read. However, Palladio allows users to filter some of the data that goes into a visualization. For instance, we were asked to create a graph that illustrated the relationship between Interviewers and Interview Subjects. We were then able to use facets to further filter the data that went into the visualization. In this case we chose to filter by Gender and Type of  Work. I was not able to discern any particular patterns from this exercise, but it showed that the strength of network analysis relies on its ability to focus one’s attention on specific types of connections. Some will prove to be very revealing, while others much less so. But the possibility of changing the elements of the graph and exploring different configurations is where the possibilities of Palladio proved most useful.

Needless to say, however, the power and flexibility of the tool is largely contingent on the data that is used. The last set of exercises confirmed both that network analysis allows for very interesting explorations of data, but also that such data needs to be already rich and adequately formatted to allow for a successful exploration. In the last set of exercises we created network graphs that connected gender, type of work, age, and interviewer to the topics that were explored in the interviews. The different visualizations generated showed that neither of these factors seemed to have a dramatic impact on the topics addressed by former slaves. However, these observations are based on the general overall visualizations. Subtle differences may yet to be discovered if we were to further filter the data. Which brings me back to the factors that can make or break this kind of tool, first the quality and richness of the data itself, and the level of expertise of those designing and using the tool.

Could this not be asked of any other research project, digital or otherwise? Is the expense and preparation invested in this kind of project proportional to the time saved or the potential findings? In my original review I concluded that it is not always clear that the research gains justify the investment involved in creating and deploying this kind of tool. However, I also observed that what is gained may be of a different nature. Network analysis tools are not tools for the public historian hoping to bring historical thinking and historical sources to a larger public. These are sophisticated tools of analysis that should be developed by experts for experts. Their design and use require serious understanding of the sources and historiography. I am sure that had I been better versed in the history of slavery and emancipation in Alabama, some of these visualizations would have been much more meaningful to me. My experience working with Palladio, however, encouraged me to be a better historian, to be more thoughtful and intentional about the questions I ask, more careful about the assumptions I make about my evidence, and ultimately, more flexible and creative about how sources can help answer old and new questions. As it was stated repeatedly in our readings, network visualizations are not here to replace the exercise of reading through sources or becoming familiar with historiography, they are here to make us better thinkers and users of sources and historiography.

Kepler and Mapping Tools

Mapping tools allow users to organize, search, and contextualize sources and information using spatial and chronological referents. These tools enable us to create visualizations that represent the different types of information contained in a dataset, the geographical points of reference for sources, and the chronological evolution of sources and their content.

The exercise using Kepler shows that even an entry-level mapping tool can prove very useful to create visualizations that communicate different aspects of the data included in a collection of sources. For instance, the first map we created was a point map. In this type of map, every item of data (in this case every interview) appears as a single dot in a map. The number of dots in the map is equal to the total number of interviews that were conducted in the state of Alabama within the period of time covered by the dataset. This kind of map also allows the user to get some basic information about each interview, such as name, age, gender, and place of birth of the interviewee. When designing the map, it is possible to customize the kind of information available to the viewer. I found this to be a very useful entry point to the data and one that can be customized to facilitate different types of searches.

We also experimented with cluster and heat maps. These maps are meant to represent, respectively, the absolute and relative density of interviews in a particular area. I found the cluster map easier to interpret. If one hovers the cursor over the clusters, one just gets the total number of interviews included in that cluster, but no information about particular interviews. I found the Heat view more difficult to interpret, but I admit that this may have been my fault since I was not entirely sure what this view was meant to represent. Furthermore, the heat map does not offer any additional information about the interviews represented in this type of map.

My favorite map was the timeline map. This is a point map with a timeline attached to the bottom. This map allows the user to locate all the interviews conducted in the state of Alabama during the period of time covered by the data set. It also allows one to see when those interviews took place within the timeline. One can still get information about individual interviews by placing the cursor on a point in the map. In addition, one can use the slider in the timeline to see points appear in the map as time goes by. This map adds a temporal dimension to the spatial one already represented by the map.

We also experimented representing differences between the interviews contained in the data set. In this case, we chose the field “Type of Slave” to be accounted for in the visualization. In this version of the map, one could see points of different colors depending on whether the interviewee was identified as a house or field slave, or both. 

Working with Kepler confirmed my opinion that mapping tools can be useful when presenting, exploring, and analyzing data. Tools like Kepler have something to offer the observer or casual visitor to a site. They enable the creation of powerful visualizations that synthesize a large volume of information in an interface that is familiar to most people. We saw a great example of this in the Histories of the National Mall project. Researchers who are just getting started working with a collection of sources, will also find map visualizations very useful. A good example of this was Photogrammar, which offered a very flexible interface that allowed the user multiple points of entry into the collection. But more experienced researchers can also find use for these kind of tools. Mapping the Gay Guides illustrates how a thoughtful preparation of the data that considers and accounts for changes in the sources themselves, allows researchers to identify and document patterns that would be more difficult to detect if one was just reading the original sources. Overall, these sources facilitate cross-referencing between different possible areas of analysis. Mapping tools are most useful when they can offer a diversity of entry points and the possibility to see how changes in space and time affect the ideas and experiences represented in the data.

Voyant and Text Mining

Working with Voyant was quite intimidating at first. In many ways, it confirmed the impressions I had formed from reading about other text mining projects, and about text mining in general.

Sources and Materials

Text mining allows scholars to works with large collections of text, what is technically called a corpus. By applying techniques of text mining to these collections, scholars can discern trends in the use of words and/or phrases. The advantage of using text mining techniques lies precisely in the amount of sources that can be “read” in a relatively short amount of time. For example, in the three projects examined during this module we saw that in the America’s Public Bible: A Commentary, (APBAC) the author looked at two major newspaper databases Chronicling America and Nineteenth Century U.S. Newspapers. Between these, the project used more than 13 million pages. Robots reading Vogue (RRV) used every issue published by Vogue, around 400,000 pages, plus 2700 covers. Signs@40 used the archive of the journal Signs from 1975 to 2014. In all three cases, no single human being would be able to read the entire corpora used in these projects in a single life-time. 

However, not all large collections of text are equally useful or available for text mining. The use of computational methods for text mining requires that text collections are digitized using high quality techniques to minimize mistakes.  Furthermore, text collections also need to be in the public domain, or potential authors should acquire necessary permissions for text mining.

In our exercise with Voyant we worked with the WPA Slave Narratives which include more than two thousand interviews with former slaves conducted by staff of the Federal Writers’ Project of the Works Progress Administration. The materials were made available to us already cleaned and organized in 17 easy-to-use files. Having read how difficult and time consuming it can be to simply prepare a corpus for text mining, I was grateful to have this part of the process done for me. However, it is important to not forget that anyone hoping to embark on a text mining project will have to invest time and expertise on making sure the sources are adequately digitized and formatted.

What can we learn?

If one is lucky and/or persistent enough to secure the rights to a significant corpus, text mining can tell us several things about the text collection, the people who created it and organized it, and the world in which it originated. One common use of text mining is seeking trends in the usage of particular words or phrases. This is done in all three of the projects examined, although each uses this ability in different ways. For instance in APBAC, text mining is used to detect specific biblical passages. This allows the author to find out how often was a particular passage used and in what context. In RRV  one can find two examples, Word Vectors and n-gram Search where text mining is used to discern the evolution of word usage overtime. Another use of text mining is topic modeling, this traces words used in a particular context to detect important topics within a set of texts. This is used prominently in Signs@40. In general, the text mining tools used in these projects tell us about the evolution of language, ideas and practices over a period of time as reflected in the pages of publications or documents.

Working with Voyant was a little confusing at first. It took me some time to understand how to manipulate the different visualizations and understand what they were telling me. However, once I started to get a better sense of what the tools allowed me to read, I started to see their potential. The Cirrus tool may seem like an oversimplification of a long and complex text. In some ways it is, but it is this ability to present a relatively simple image of what the text is about that makes it useful. One must remember that the goal of these visualizations is not to give us a deep analysis of what this vast amount of text says or means, its objective is to help us identify a few entry points, a few questions that one could explore when one is facing a large amount of documents. Many of the terms that appeared more frequently in the whole of the corpus were clearly a function of patterns of speech and regular conversation. Words like “old”, “house”, and “slaves” were among the most frequently used terms. However, when I started focusing either on individual terms, or on specific states and terms, I started to find some interesting things. For instance, the term “mother” appeared quite prominently in the general word cloud, but if one focused on the links to this word one saw that it was most frequently connected to words like “father”, “sold”, “died”, “married”, and “children”. These, quite literally, painted a picture. I could imagine tracing the phrases that include the word mother to investigate or illustrate how motherhood was experienced or remembered by former slaves.

What questions could we ask?

Text mining analysis allows us to answer primarily general questions about the contents of a large collection of documents. Since it focuses primarily on text, it can answer questions about how language is used, how people articulated their ideas and practices, and how all of these evolved overtime. However, one has to cultivate a healthy skepticism when working with text mining techniques. First, anyone’s ability to identify meaningful entry points into a large corpus is limited or enhanced by their understanding of the historical and historiographical context in which those sources were created. In this regard, for instance, it was useful to know that there is a body of research that has investigated the experiences of female slaves and that, this historiography has given particular attention to motherhood. I am not a expert on this field, but I knew enough to know that following that term could lead to some interesting questions. A second factor that can affect the questions we could ask from text mining has to do with the chronological or geographical coverage of the collection in question. Some of the collections used in the projects examined in this model covered a no less than forty years. This meant that those working on those collections could ask questions about change or continuity over time. The Slaves Narratives collection was different in that, chronologically, it covered a relatively short period. Even though the memories that interviewers tried to elicit went back many years, the actual interviews were collected during a span of only two years. However, the interviews covered a large portion of the country. Seventeen states were represented in the dataset we used. In light of this, the nature of the questions one can reasonably ask from these interviews is quite different. Rather than focusing on how themes may have changed over time, one would ask how do interviews in one state are different from another?

For instance, using Voyant, I found it very useful to identify differences between the collections that could tell us more about the how the interviews were collected and how to read them. One exercise that was particularly useful was looking at the distinctive terms identified in two sets of documents. One of the states I examined was Florida, here I examined ten distinctive terms. It was interesting that three of these were names of places located in Florida and two were Family names. I thought this would be quite typical of all collections, but when I examined the interviews from Georgia, I was surprised that most of the distinctive terms in those interviews were related to dialect, only one was the name of a place, and there were no family or private names. One would need to investigate these collections further to account for these differences.

Historians typically divide sources between primary and secondary, and this distinction determines the kinds of questions they can ask. It is not news to any experienced historian that sources such as the Slave Narratives are difficult to place in either one of these buckets. Working with Voyant, however, highlights the importance of understanding when and how the Slave Narratives can be used as primary sources and when and how they can serve as secondary sources. Since text mining allows us to capture the totality of a corpus and then break it down in smaller pieces, one should be careful that in trying to put it back together one does draw connections that may not be warranted by the historical or historiographical context.

In the hands of a patient and knowledgeable historian, Voyant and text mining in general, can be powerful tools. Despite the care and time one needs to invest in acquiring rights, cleaning data, testing algorithms, etc. Text mining makes it possible to examine what otherwise would be an impossibly large amount of text, and thus offers a different perspective on one of the oldest and most valuable expressive and communication tools we have: words.

Review of ARTStor Digital Library

Overview

The ARTStor Digital library includes close to 300 collections with about 2 million images. The Digital Library consists of Private Collections held by many prestigious museums, universities, artists’ libraries, and photo archives. One can find images of objects contributed by The Art Institute of Chicago, The Metropolitan Museum of Art, the Peabody Museum for Archaeology and Ethnology, The Warburg Institute, The Rijksmuseum from the Netherlands, among many others.

The Digital Library also includes several Public Collections that store some 1.3 million images, videos, documents and audio files from libraries’ special collections, faculty research, and other institutional materials. Public collections are cataloged, managed, and shared by institutions such as Cornell University, Colby College, RISD, and MIT using JStor Forum.

Here you can find a complete list of the Collections included in the Digital Library.

History

ARTStor was first started by the Andrew W. Mellon Foundation during the 1990s. The initial goal was to facilitate the use of digital images for research and teaching in the arts and humanities. Since then, the number of contributors has grown to include some of the most prestigious museums in North America, Europe and Asia. Here you can find more on ARTStor’s Mission and History.

Facts

Materials available in the database range from antiquity to the twentieth century and include objects from all five continents. The Digital Library includes digital versions of a wide range of objects from paintings and sculptures, to photography, architecture, audio, and video. Some collections consist of more than 10,000 items, while others can hold less than 100.

Each collection is curated to include a selection of objects held at particular institutions. These items have been selected for their importance to the educational mission of ARTStor. According to the “About ARTStor” page, items included in the collections have also been “rights-cleared for use in education and research”. However, items held in collections outside the United States may still be protected by the laws of the countries where they are held. Users are advised to check the Terms and Conditions of each collections to ensure proper use if individual items.

Publisher

ARTSTOR is published by ITHAKA a non-profit organization that aims to facilitate the use of digital technologies for researchers and teachers. 

Search and View Options.

  • It is possible to run both Keyword and Advanced Searches of the Digital Library. An Advanced search can be done by Creator, Title, Location, Repository, Subject, Material, Style/Period, Work Type, Technique, Number, SSID, and Repository ID. It is also possible to narrow searches by date, collection, classification, and geographical location. 
  • The “About ARTStor” page in the site states that “images come with high-quality metadata from the collection catalogers, curators, institutions, and artists themselves.” Given the diversity of objects and repositories, there are some differences in the types of Metadata used in different collections. Equally, not all collections provide the same degree of information on their Metadata practices.
  • ARTStor images can also be found through JStor.
  • The Support page includes detailed instructions on how to conduct different kinds of searches.
  • The Search options in ARTStor are useful and easy to use. There are many ways to expand and limit searches. There is also the possibility to browse collections, which I found very useful.
  • The ease for Browsing and Viewing items in the Private Collections is not always consistent. In some cases, when a user chooses to explore a particular collection, they are directed to an institutional site outside of the ARTStor interface, where there browsing and viewing experience is different from what is the standard in ARTStor. I found that a couple of the links to external sites were no longer active. There is a way to contact ARTStor to inform them of these problems.

Other tools and features.

  • Powerpoint Assistance: It is possible to download images directly into a Powerpoint presentation together with citation data.
  • IIIF Image viewer: this allows to see images in full screen and compare up to ten items at once.
  • Groups: It allows the user to organize groups of images for specific lectures, courses, or to share through a course management system. Groups of images can also be turned into flashcards to help students study and also create citations in different citation styles.

Access

  • Access to the Private Collections is granted to contributing institutions and libraries through subscription. Pricing for institutions in the United States is calculated using the Carnegie classification and is as follows: Very Large: $16000, Large $11,500, Medium $6,950, Small $4,250 and Very small $2,500. 
  • In 2018 ARTStor started to offer free access to its public collections and to the collections from JStor Forum contributing institutions. 

Other Reviews

Terms of Use and Citation.

  • Given that individual items have been contributed by different institutions, there are also different citation requirements. Fortunately, it is possible to have the site generate the correct citation.
  • Each collection has been curated to include items that have been cleared for educational, research and other non-commercial uses. However, items from foreign institutions may still be subject to different copyright laws and rules. Individual items include the necessary information about rights and permissions.

A Guide to Digitization

This is a brief introduction to some of the questions you will need to ask yourself when you decide that you need to digitize materials for your digital project. Please keep in mind that this guide is not meant as a substitute to more detailed guidelines like those produced by the Library of Congress or Europeana. Rather, I hope you will use the following questions as means to reflect on the challenges and opportunities that come with the use of digital materials.

I.- What are your goals? Who is your audience? 

As with any other kind of project, you should first define your goals. Most importantly, you should ask yourself what is that you hope to achieve by including digital materials in your project. Perhaps you are hoping to make some texts or objects available to people who do not currently have access to them; or you want to highlight certain aspects of these materials to illustrate your ideas, reinforce your arguments, or present them in a different context. In either case, having a well defined set of goals will dictate many of the choices you will need to make when you start digitizing materials. 

You will also need to be very clear about the audience you are hoping to reach. How much familiarity or understanding can you expect your target audience will have of the digitized objects you plan to include in your project? Remember that our perceptions are strongly influenced by previous knowledge so, when thinking on what you can digitize and what is that you need to capture in those digital copies, you will need to take into consideration what your target audience may already know, or not know, about these materials.

Keep in mind that the more numerous or broad your goals are, the more difficult it will be to make digital copies that are useful. For instance, if your goal is to simply make a photograph available to more people, you may choose not to worry about including different versions of the photograph (in different resolutions). But if you are targeting a more expert audience, who may want to make copies of this photograph for use in different media, it may be better to include different versions of the photograph. Similarly, if your goal is not just to show the images in the photograph but also the materials and condition in which the photograph is, you will need to develop a strategy that will capture the specific aspects of the photograph you are hoping to communicate to your audience. This can include video, higher resolution images of specific elements of the photograph, or descriptive text.

II.- What do you need to capture?

Once you have defined your goals and your audience you need to think about what is that you can digitize. Your need to ask yourself the following questions:

What materials do I need?

Do I have access to these materials?

Do I have a legal right to make digital copies of these materials?

Once you have an idea of what are the materials you need, where to find them, and have the appropriate permissions to use them, you will need to decide what is that you need these objects to represent. 

This will force you to refer once again to the goals of your project. How do you expect the users of your project will engage with these objects? Do you want them just to see the general characteristics of the objects, or do you want them to be able to appreciate more details such as size, texture, or even sound. Keep in mind that when digitizing you are making a digital copy of an object, text, or even sound, and that all copies, by their very nature, are an imperfect representation of the original. Thus you need to make decisions on what compromises you are willing to make, what elements of the objects should be captured in your representation, even if this means not capturing other aspects of the original. 

For example, let us say you need to include an Arabic manuscript in your project. Is it important or even necessary that your users see the conditions of the paper, the original calligraphy and how the pages of the manuscript are bound, or is it more important that they can read the content of the text. A good quality photograph will help you achieve the first goal, though you may also find necessary to include a narrative description. If your goal is just to convey the text of the manuscript, you may decide between using a scanner or making a transcription. In this case, your decision will have to take into account whether your audience is familiar with the Arabic language and Arabic script.

Also keep in mind that when we digitize an object we are creating a representation and that context and framing are also part of this representation. Your representation of an object does not end with the digital copy of the object itself, it extends to the webpage in which it appears, the text it is accompanied by, and the other objects that are also represented in your project. 

III.- What media should I use?

Your choice of media will largely depend on:

  1. The nature and condition of the object you want to copy.
  2. What you hope to capture from the objects you want to digitize. 
  3. Your own level of comfort and expertise using different media. 
  4. Technical restrictions such as storage capacity, ease of use, etc.

Most of us are reasonably comfortable taking digital photographs, yet, the pictures we can take with phones and tablets may not always capture all we need from certain objects. Remember that digital photographs are a two-dimensional rendition of what often are three-dimensional objects, so you need to consider whether the photographs capture all the elements of the object that you need to convey to your users. Another option is video, which may allow you to film yourself or others interacting or manipulating an object, thus allowing you to convey a lot more information about it. However, making good, useful videos and editing them requires more expertise and resources that taking a still photograph. Not to mention that videos require more memory to store and display. In this case, you will need to ask yourself if you can work with a combination of media. For instance, instead for taking a video of a painting where you focus on different elements of the painting from different vantage points, you may choose to write a detailed description of the general size and materials used in the painting. But of course, this compromise is only appropriate if the goals of your project only require that users can see the general image of the painting. If your project requires that your users appreciate the conditions and actual size of the painting, you may decide that some form of three-dimensional rendering is in fact necessary. 

Often times the media used to digitize an object will be dictated by the condition of the object itself. It is common these days that archives will not allow the use of scanners or flash photography to make copies of documents. Same rules may apply to paintings, prints, etc. Always be mindful that making digital copies of objects, texts, videos or sounds, allows us to preserve certain aspects of those materials but may also contribute to its deterioration. 

Is it worth it?

There is not question that digital copies are imperfect representations of the original materials and that when digitizing materials one always runs the risk of mis-using them or even damaging them. Yet, much can be gained from this process if it is undertaken responsibly and thoughtfully. In addition to allowing for greater access to materials that may have been out of reach for many people, digitization offers us the opportunity to reframe, rethink and re-evaluate ideas, people, objects.

South African History Online

https://www.sahistory.org.za

Rights Statement

https://www.sahistory.org.za/policy

This site includes articles, images, videos and other items either created by SAHO researchers and contributors, or collected by the site. Some materials are in the Public Domain, others are under a Creative Commons License, and there are also materials protected under Copyright.

Islamic Manuscripts of Mali

https://www.loc.gov/collections/islamic-manuscripts-from-mali/about-this-collection/

Rights Statement

https://www.loc.gov/collections/islamic-manuscripts-from-mali/about-this-collection/rights-and-access/

This site includes 30 digitized manuscripts from the Mamma Haidara Commemorative Library and the Library of Cheick Zayni Bay of Boujbeha. The Rights Statement states that the items included are not under any known copyright restrictions. However, it is requested that anyone seeking to make additional reproductions should seek permission. 

Prelinger Archives.

https://archive.org/details/prelinger?tab=collection

Rights Statement

https://archive.org/details/prelinger

This site includes digitized copies from film, particularly home movies, amateur films and industrial films. According to the Rights Statement the collection includes materials that are licensed under a Creative Commons Public Domain license. It also contains materials that do not carry a Creative Commons License. Users are encouraged to contact the archive to seek further information on how to secure permission for use. In addition, description, synopses and other text  and metadata provided by the archives is copyrighted by the Prelinger Archives and Getty Images.